The Challenge of Bluetooth Distance Estimation
Estimating distance with Bluetooth has long been a source of befuddlement and controversy. Developers often have trouble making it work and there is debate about whether it works well enough to be useful. That debate has been rekindled by its use in contact tracing apps designed to fight infectious disease.
Bluetooth Distance Estimates 101
The idea is simple. A radio transmitter sends out a signal to a receiver. The receiver measures the strength of the signal. When the transmitter is close, the signal is strong. When the transmitter is far, the signal is weak.
Reversing this logic, if we see a weak signal we might assume the transmitter is far and a strong signal that the transmitter is near. But what signal level indicates near and what signal indicates far?
The answer to that question depends on the strength of the transmitter and how good the receiver is at picking it up. The solution to this problem is to measure the signal at a known distance. A distance of one meter is typically used because it is close enough for the signal to be strong but far enough to avoid “near field” effects that can make radio signals unpredictable.
So a simple distance estimation might work like this:. If the known measured signal level at 1 meter is -50dBm, and we see a slightly weaker signal, then that means the estimated distance is just a bit further than one meter. To aid in this calculation, a Bluetooth transmitter can actually send a data packet containing this “measured power” or “tx power” value. That way the receiver knows the proper reference point for different transmitters with different power levels.
The Math
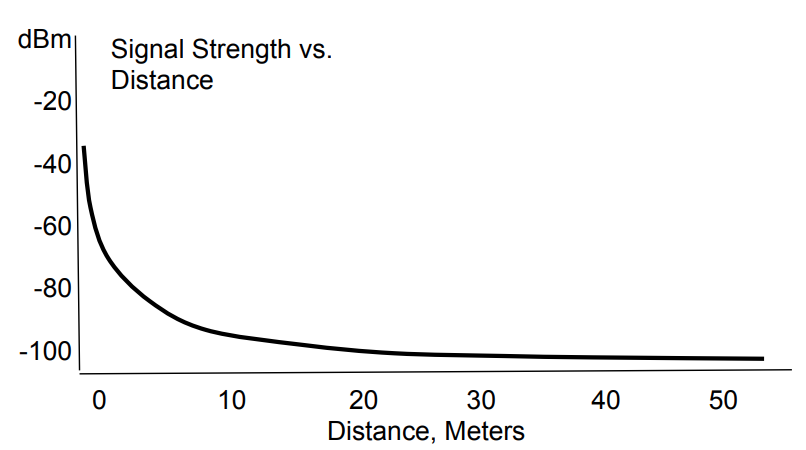
Converting this information to a specific distance is theoretically possible because the energy in radio waves decreases exponentially with distance. A graph shows a curve like above.
The units are decibels relative to one milliiwatt (dBm), and values are negative with more negative signals indicating a weaker signal. This is a logarithmic unit so a decline in 10 dB of signal level (e.g. from -50 dBm to -60 dBm) means that the power has declined by a factor of 10 – only 10% of the signal power remains.
The graph above can be explained by theoretical physics using this equation: 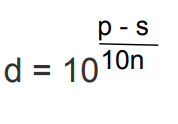 where p is the measured power at 1 meter, s is the signal strength and n is a constant that describes how easily the signal passes through the air.
While that equation works, it is typically not as good at estimating distance as power functions using a curve fitting technique. The reason the equation offered by physics doesn’t work quite as well in practice is because there are other factors going on that involve more than radio signal theory (more on that below.) Here is an equation with a similarly shaped curve derived experimentally using a Nexus 4 as a Bluetooth receiver. This is Java code:
protected static double calculateDistance(int measuredPower, double rssi) {
  if (rssi == 0) {
    return -1.0; // if we cannot determine distance, return -1.
  }
  double ratio = rssi*1.0/measuredPower;
  if (ratio < 1.0) {
    return Math.pow(ratio,10);
  }
  else {
    double distance =  (0.89976)*Math.pow(ratio,7.7095) + 0.111;
    return distance;
  }
}
The above equation estimates distance using the measured power at one meter (received from the transmitter via a field in a transmitted data packet) and the signal strength measured by the Bluetooth chip. The signal strength is measured on a phone using a field called the Received Signal Strength Indicator with units in dBm. (More on that later.)
Does this work?
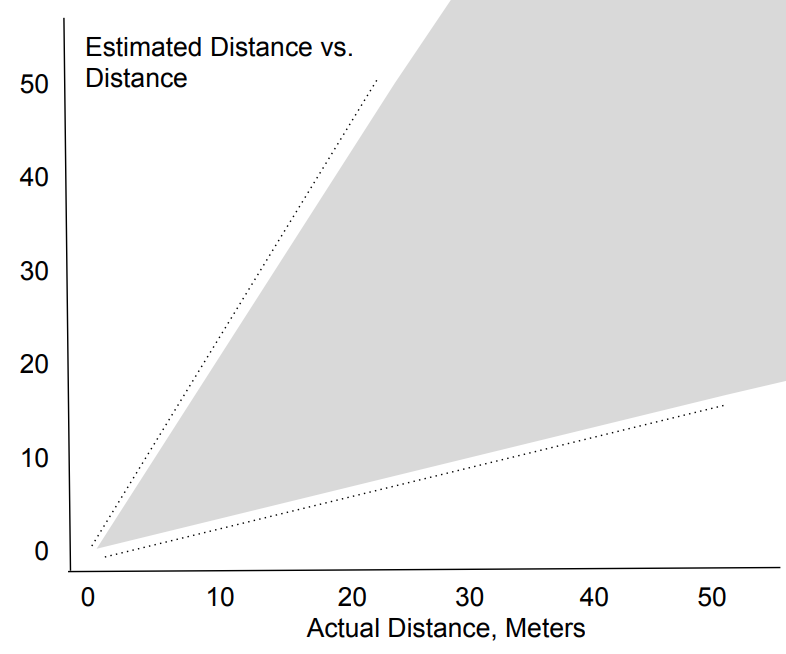
Roughly, yes. And short instances of a few meters the above equation can give you an approximate distance estimate. The closer to the one mater reference point you are, the more accurate the estimate might be. Under ideal conditions (clear line of sight, no reflective surfaces nearby) you might get an estimate of 1m +/- 0.5 meters when you are really one meter away.
Do not expect this to be able to tell you the difference between being 1.1 or 1.2 meters away. It’s just not that accurate.
The further you go away, the less accurate the distance estimates get. At a real distance of 2 meters, the calculated distance estimate might be 2 +/- 1 meter. Note that the margin of error has doubled. The same thing happens the further you get away – the margin of error keeps getting bigger. Eventually, when you are over 10 meters away, the distance estimate has very little accuracy. It can tell you that you are far away (e.g. > 8 meters, but it can’t tell you how far.)
The reason this happens is that the signal power declines exponentially the further you get away. Bluetooth radios are weak transmitters to begin with. Maximum range is typically around 100 meters. But before you get anywhere near that distance, the signal is so weak that it is barely detectable. At a range of 30 meters, the signal level typically declines to about -100 dBm. This is typically the weakest signal level that a receiver can hear. At 40 meters, the receiver will fail to receive most packets as the signal is so weak it is indiscernible from background radio noise. The packets it does receive have the same measured signal level of about -100 dBm as seen at 30 meters – the receiver just gets fewer of them. Those packets it did get were lucky to be heard.
Distance estimates simply cannot tell the difference between a transmitter 30 meters away and 40 meters away because the signal level looks nearly identical to the receiver. It is similarly weak in both cases.
Is This Even Useful?
Absolutely! If what you care about is telling if a transmitter is nearby (within a couple of meters), this works quite well. Also, if you care which of two transmitters is closer at short range, Bluetooth Distance estimates can also work very well. Such rough distance information is extremely valuable for many purposes.
But it all depends on your use case. If you need very accurate distance info (if it is important to distinguish 1.5 meters from 1.8 meters) this will never work for you. Likewise, if you need to measure specific distances at larger ranges (10 meters or more) this will fail.
Set your expectations realistically.
Usage for Contact Tracing
Contact Tracing apps often seek to determine how close two people came to assess infection risk. Did they come within 2 meters?
Some folks poo poo Bluetooth distancing for this purpose because it is not accurate enough to tell if two people are within 2 meters. It will lead to lots of false positives and negatives.
This criticism is simply wrong. Yes, Bluetooth distancing can give you a very good indication that two people came about 2 meters away from eachother. The distance estimate won’t be exact. But the 2 meter criterion is rather arbitrary anyway. Is there really zero risk of infection at 2.1 meters and an infinitely higher risk at 1.9 meters? Of course not! For the purpose of a contact tracing tool, what is important is to know if two people came “pretty close”. Yes, Bluetooth distance estimates can answer that question. They are not perfect. But no measurement with any tool is perfect.
For the above to work, there are many complicating factors that should be realized, some of which must be factored in to the distance estimates. More on those complications below.
Going Beyond One Dimension
The technique described so far, based on a single signal measurement, only works in one dimension. While you might be able to estimate the distance between a receiver and transmitter, you don’t know where they are in two-dimensional space. You can’t plot the receiver’s position within a room on an X/Y grid based on one measurement. A popular math exercise is to use multiple transmitters and “trilaterate” the X/Y coordinates of the receiver. While this is a fun exercise, it is rarely practical because the margin of error in the distance estimate gets too large once you are more than a couple of meters away. For this to work reliably in practice, you need a really small room.
An alternative technology called RSSI fingerprinting uses completely different techniques to locate a radio device in two-dimensional space.
Misusing Bluetooth Distance Estimates
There are many cases of people misusing this technology in ways that gives it a bad name. The United Nations recently released a an app called One Point Five that notifies you every time it estimated that another Bluetooth device came within 1.5 meters to warn of infection risk. Critics panned the app for high false positive and false negative rates.
The implementation is horrendous. The app looks at every Bluetooth signal regardless of the device type, does not use a reference power value to do the distance estimate, and does nothing to correct for receiver efficiency variations.
As a result, the app goes off all the time at all kinds of distances while people walk by Bluetooth-enabled parking meters or garage door openers. And the app often never alerts on close contacts with other people’s phones, because those phones happen not to be emitting anything over Bluetooth. This happens mainly because the app lets you to get notifications based proximity to other phones without the app – a promise on which it can never ever hope to deliver.
The design for this project was terribly flawed from the start and it never should have been released. But it is a huge mistake to dismiss a technology because some crappy apps misuse it. Just because some people don’t know how to use a tape measurer to properly cut a piece of wood doesn’t mean the rest of us should give up on tape measurers.
Complicating Factors
There are lots of factors that complicate Bluetooth distance estimates. Each one might merit a blog post on its own, so we can only introduce them here:
Phone Hardware and Bluetooth Stack Variations
- Non-Spherical Antenna Patterns: antennas are not equally good at transmitting or receiving signals in every direction. Every phone model has a different antenna and the signal will be weaker in some directions. When graphed, this typically looks like a heart-shape. On one side there is a pronounced recession with a weaker transmission/reception. Depending on how you point your phone, signal levels will change.
- RSSI Sensor: the signal measurement is done by a Bluetooth chip that typically uses an 8-bit analog to digital converter to get a value of 0 to 255, where 255 is the strongest signal. There is code in the Bluetooth stack to convert these values to a value in dBm. How good this measurement and conversion actually represents a true value in dBm depends on all kinds of engineering factors. How much care did the phone designers take here? Did they simply copy the conversion from a completely different phone model without adjusting it for new hardware differences? Often times, particularly on cheap Android phones, the answer to the last question is certainly yes.
- Bluetooth Channel Rotation: Bluetooth LE uses three different advertising channels, each of which uses a slightly different radio frequency. When scanning for advertisements, each phone model rotates between these frequencies at a different rate, ranging from a fraction of a second (iPhone) to 10 seconds (Samsung). Because the antenna is tuned for peak detection at a single frequency, the measured RSSI will vary by a few dB depending on which channel it is on. This can have a big effect on distance estimates, and there is no way to read the channel you are on, so the only way around this is to sample data over longer periods of time than the worst-case rotation rate across all channels (e.g. 30 seconds).
- Phone Case: A phone’s case (especially if metal) and component placement will affect the signal strength and antenna pattern. A user-installed phone case can do the same, although the more typical ones made of polymers typically have a minor effect. But you never know when a teenager has metal “bling” embedded in the case right by that Bluetooth antenna.
Environmental Factors
-
Radio Noise: Bluetooth LE uses the same radio spectrum as WiFi, Zigbee and other consumer electronics technologies and this space is often congested. Other radio signals at different frequencies often bleed into this space as well. I live across the street from a military base with powerful antennas that make packet reception rates much lower in my house than when I am in other locations. Radio noise can both prevent packets from being received and affect the RSSI measurement itself. The further you are away (the weaker the signal) the more effect radio noise has on your measurements. Once Bluetooth LE signals drop below about -100 dBm, they reach what is called the “noise floor”. This means the receiver can no longer distinguish the 1s and 0s being transmitted from background noise.
-
Obstructions: Walls, furniture, shelving, plants, he human body and other objects all absorb or reflect radio energy to some degree (more than air, anyway). In general, plastic and wood tend to be fairly transparent to Bluetooth frequencies. Metal is much less so. Whenever there are obstructions between the transmitter and the receiver, the signal level will go down relative to what it would have been with a clear line of sight. How much so depends on the materials in the obstructions and if the radio waves can find a way around them.
-
Reflections: All objects, but particularly metal ones tend to reflect radio waves. The effect is not as simple as visible light in a mirror, but the result is analogous. This can amplify signals if extra radio energy arrives at the receiver due to reflections.
Human Factors
- Human body: The human body is an obstruction – a big bag of conductive salt water. A crowd will absolutely attenuate signals. A dense crowd more so.
- Pocket and Purse: If a person has a phone in a pocket then the radio signal on the opposite side of the body will be weaker than on the side where the phone is not obscured by the body. A purse has more complex effects depending on the materials and other contents of the purse. Since people tend to move around and take their phones out of their pocket or purse, this effect usually changes over time. Depending on your use case, the fact that people move their phones around can be either a blessing or a curse.
The Curse of Fragmentation
When Apple unveiled the Bluetooth LE iBeacon format back in June 2013, Bluetooth distancing was put on the map. Since then an explosion of phone models has complicated the situation. This makes it impossible to get accurate absolute distance values from Bluetooth distance estimations unless you correct for device variations.
Transmitter Variations
Apple’s plan for handling hardware transmitter variations was called calibration. An iPhone app would be used to collect signal levels when the phone was held precisely 1 meter away. This procedure would give you an averaged value over, say, 30 seconds. The reference RSSI at 1 meter could then be programmed into the beacon transmission as a one byte value.
A beacon with a strong transmitter might be detected at -55 dBm at 1 meter. One with a weak transmitter might be detected at -65 dBm at 1 meter. But because this expected 1 meter value is sent in the transmission, the receiver can adjust accordingly.
Receiver Variations
The calibration plan above worked great for a short time, because in June 2013 there were exactly two models of phones that could detect an iBeacon – the iPhone 4S and the iPhone 5. When it came time to calibrate your beacon, you used one of these two phones to do the reference measurement. As chance would have it, both phones measured about the same signal level when seeing the same beacon.
Since the only phones that could detect iBeacon signals were also the iPhone 4S and 5 this system worked pretty well.
But the very next month, in July 2013, this perfect world started to crumble. Google released Android 4.3 making the Nexus 4 the first Android phone to support Bluetooth LE and beacon detection. Over the next 7 years, 18 additional iPhone models would come out along with thousands of Android models. Every single one of these devices has differences in the Bluetooth chip, radio circuitry, antenna and case that affect the signal level the phone receives.
This makes it impossible for a beacon calibration performed on one phone to apply to a different phone.
There have long been dreams for a public database of device-specific adjustment factors so a correction could be applied. The open source Android Beacon Library even includes a mechanism to download such a database as it is updated after new Android models are released. But the difficulty of measuring the model-specific differences, a dearth of volunteer submissions, and a staggering number of Android models, all prevented this system from becoming a success.
One report from way back in 2015 counted 24,000 Android models from 1300 brands. The numbers have only gone up from there.
While Apple devices tend to deviate less from the old iPhone 4S and 5 reference signal levels, there are significant variations, especially on iPad models. Android phones, however, are all over the map. While many are excellent Bluetooth LE receivers, some are horrible. I have a Huawei P9 Lite that can’t detect a typical beacon more than 20 feet away. Its detected signal level at short range is often 15 dB weaker than iPhone models.
Solving for Fragmentation
In order to solve the problem of fragmentation on distance estimates, we need a good database of phone models vs. transmitter strength and receiver efficiency. Such a database might indicate that for an Android Nokia 3800GS with Type Allocation Code 1234, the transmitter power deviates +2 dBm from a reference value and the receiver efficiency deviates -1 dBm from a reference value. (This is just an example – that’s not even a real phone.) Taking the time to properly measure each device might take 30 minutes.
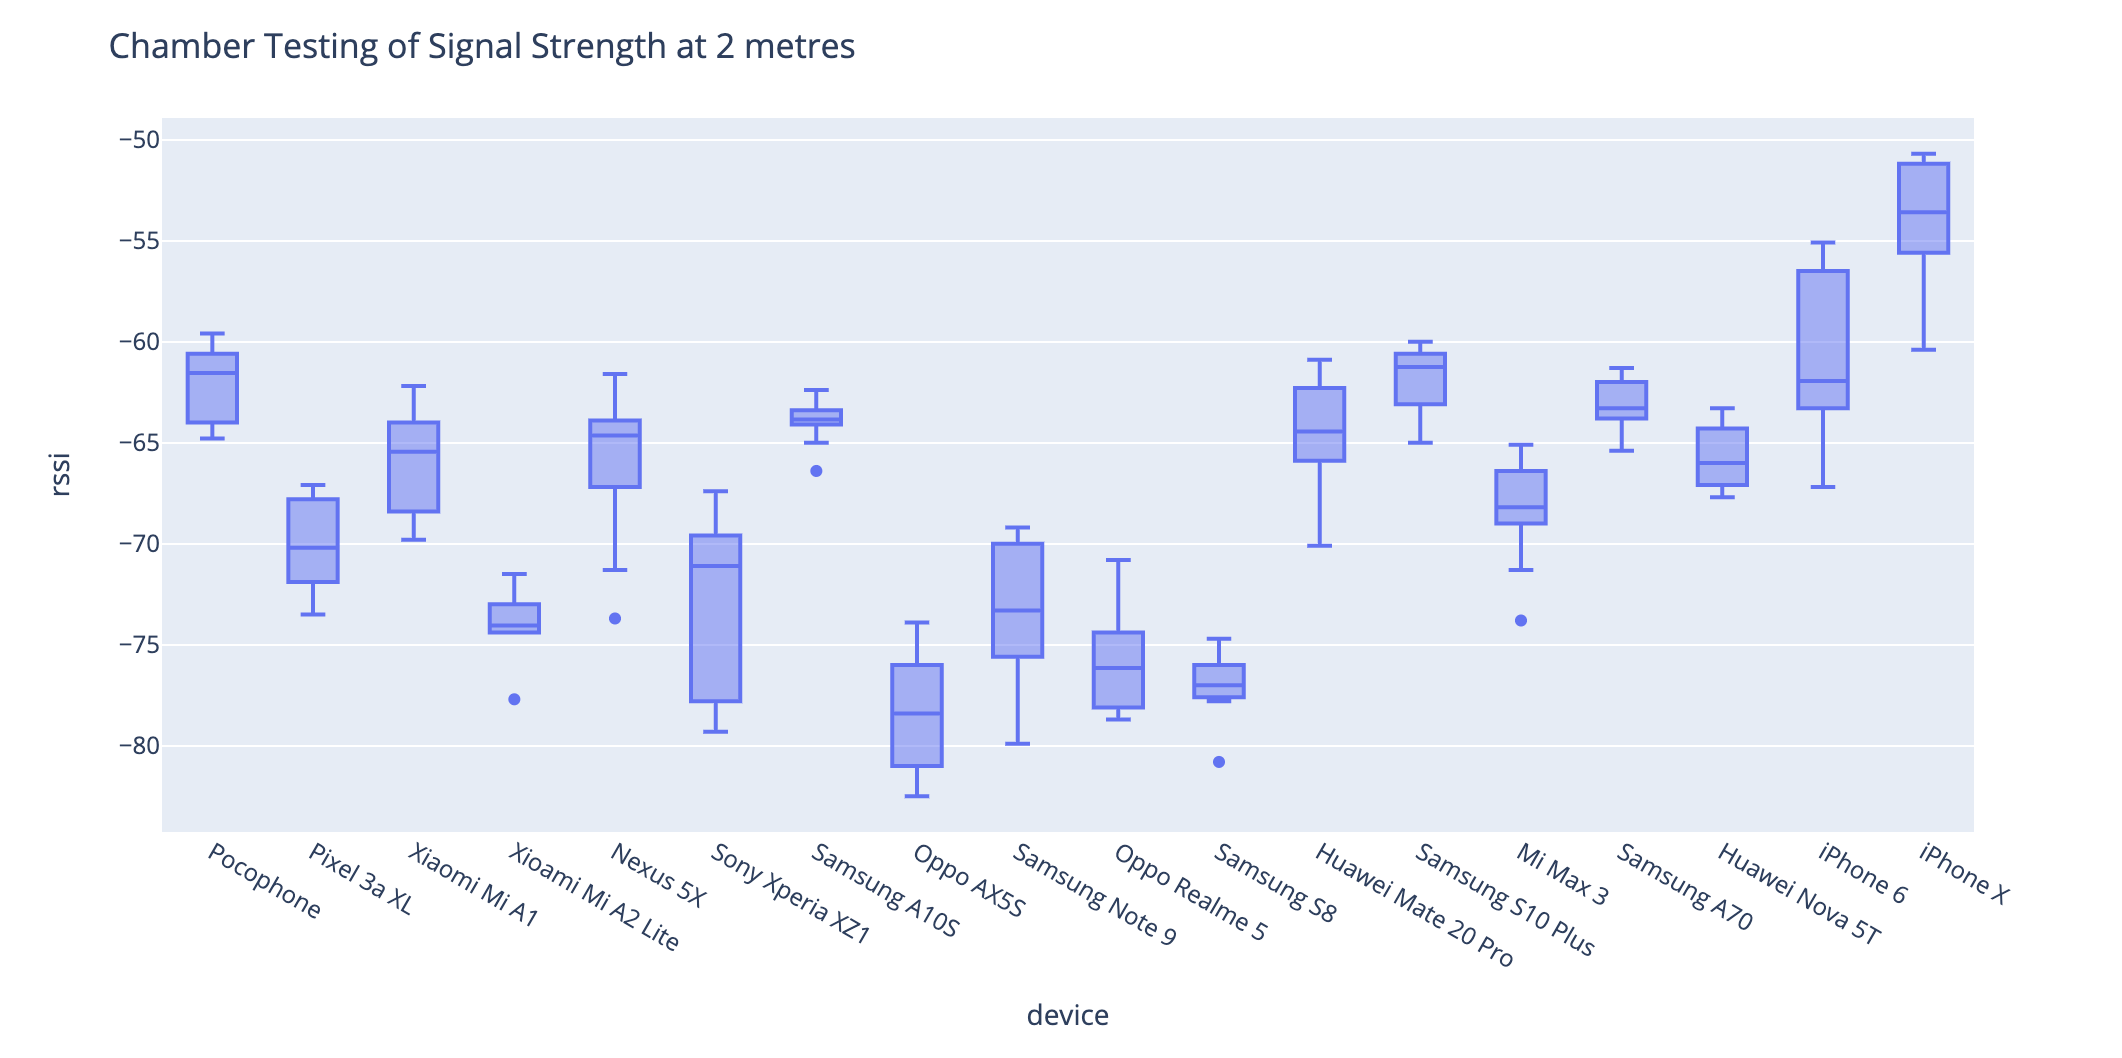
There is no way that such a database can ever hope to cover every phone model out there. But they can cover the most common ones. Singapore’s Trace Together team, for example, took these kinds of measurements using an antenna chamber for a few of the most popular phones in the Singapore market. Unfortunately, they did not capture separate transmitter power and receiver sensitivity measurements.
The fact that Google and Apple’s Exposure Notification Service includes a transmitter power byte in the the encrypted metadata gives some hope that the Silicon Valley giants plan to work on such a database. With only ~20 iPhone models supporting BLE, clearly Apple has a much easier job than Google. But as a nearly trillion dollar company, Google certainly has the resources to do measurements on at least a few hundred of the most popular devices in the market today, and support a team that updates this database in the future. Will they do this? If so, will they make the data public?
A Ray of Hope?
Without a doubt, the device fragmentation described above is the biggest obstacle to reliable Bluetooth distance estimation for many use cases.
For all the trouble that the coronavirus pandemic has brought upon the world, it has had the effect of energizing the tech community around solving some of these technical problems. Will the current pandemic inspire creation of a public database of device specific that can be used to solve the problem of fragmentation and distance estimates?
This is far from certain, but the current situation offers the best hope of a solution that we’ve had in many years.